

A viral $1.3 trillion Medicare for All savings claim collided with a reminder that who pays—and how—matters as much as what the nation spends.
Story Snapshot
- Rep. Ro Khanna said Medicare for All would cut annual health spending by $1.3 trillion.
- A Community Note flagged that the cited Yale estimate was not peer reviewed and focused on total spending, not federal costs.
- The Congressional Budget Office (CBO) says total spending could fall or rise depending on design, while federal costs jump in all cases.
- Debate centers on savings from admin cuts and drug prices versus higher use of care and new taxes.
What Khanna Claimed And Why It Blew Up Online
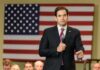
On November 18, Rep. Ro Khanna said Medicare for All would drop national health spending from $5.3 trillion to $4.0 trillion. He framed it as pro-growth and anti-inflation. Coverage tied his claim to a Yale-linked analysis reportedly showing more than $1 trillion in savings. A Community Note pushed back, saying the estimate was not peer reviewed and did not speak to federal budget costs. Critics amplified those points across partisan outlets.
Khanna’s message tapped a shared pain point: families face high premiums, bills, and drug costs even as the system feels bloated. Supporters point to savings from simpler billing and lower drug prices. Skeptics ask who pays the new taxes and whether use of care rises when coverage expands. Both questions are fair. They also reflect a larger mood: people on the left and right think Washington’s health policy serves insiders first and patients last.
What The Congressional Budget Office Actually Says
The Congressional Budget Office analyzed single-payer designs and found a wide range. In 2030, total national health spending could fall by about $0.7 trillion or rise by about $0.3 trillion, depending on program details. At the same time, federal subsidies would increase by about $1.5 trillion to $3.0 trillion in that year. That means federal taxes or other offsets would need to rise unless lawmakers cut elsewhere.
The budget office also explained what drives the math. Lower payment rates to providers and lower administrative overhead tend to reduce spending. Higher use of care, especially with long-term services included, tends to raise it. These push and pull forces change with policy choices like provider payment levels, covered benefits, and how fast the system ramps up. That is why single-point claims can mislead without the design attached.
Where The Yale-Linked Estimate Fits And Where It Falls Short
Reports say a Yale-connected analysis, requested by Khanna, pointed to more than $1 trillion in annual savings from cutting overhead, negotiating drug prices, and reducing waste. That aligns with known areas of inefficiency and echoes advocacy arguments for large system savings. But the public record does not show a peer-reviewed paper with authors, code, or assumptions. That gap weakens confidence in the precise $1.3 trillion number as an across-the-board forecast.
Advocacy materials argue that tax-funded Medicare for All could still leave many households better off if premiums and out-of-pocket costs fall more than taxes rise. That can be true for some families, employers, and states. Yet the budget office stresses that federal spending rises a lot, which brings tax and deficit choices to the front. Voters deserve both numbers: national spending and federal budget effects, side by side.
Why Both Sides Talk Past Each Other—And What Would Fix It
Supporters talk about the national total we all pay—premiums, taxes, and out-of-pocket—because it captures waste and middlemen. Opponents focus on the federal budget because Congress must pass a financing plan. Both are valid. The fight worsens when leaders do not name which metric they mean. Clear design details and a formal score from the budget office would help people judge real trade-offs and avoid spin from either camp.
Here is the practical path forward. First, release the full Yale analysis, including methods and code, so experts can test it. Second, pin down the exact benefits, payment rates, drug rules, and phase-in timeline. Third, ask the budget office and independent modelers to score the same design for both national spending and federal costs. That level of sunlight would serve patients, not just political brands.
Sources:
twitchy.com, sandersinstitute.org, commondreams.org, cbo.gov, collections.awsprod.nlm.nih.gov, townhall.com
© unitedfrontnews.com 2026. All rights reserved.